1

I've heard many times that spoken language is subjected to variations and we never make the exact same sound when we speak, even for the same word. If that's the case, how can you be so exact about the placement of certain vowels in diagrams like these, especially when talking about certain languages like Russian and Swedish which have too many vowels in a specific area that makes it very crowded and it seems like maintaining a distinction is pretty much impossible.

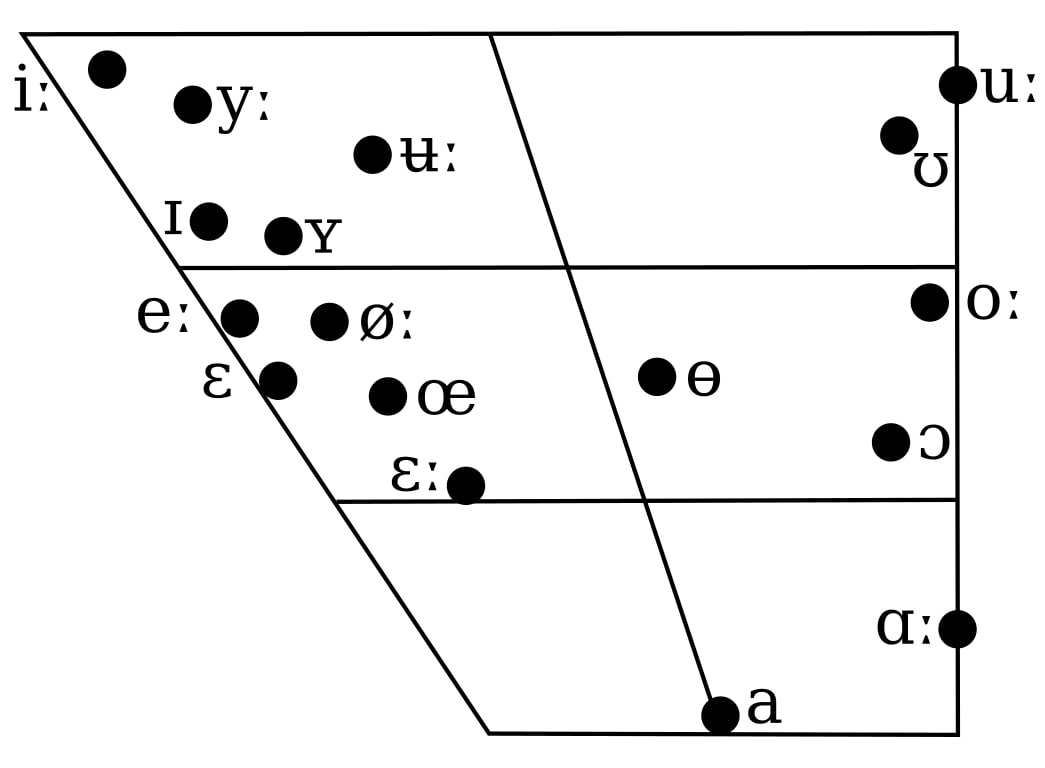
I'm fully aware of the fact that in Swedish the primary distinction between some vowels phonemes is based on rounding, but there are still too many of them and not all can be distinguished primarily by rounding. Also, does the word primary here mean that they ARE in fact distinguished on other factors as well, which might include their positions in the vowel space, which would mean that native speakers do place them separately in their mouth when they make them? Swedish vowel phonemes

1
  • 1
    What do you mean there are “too many of them”? Swedish is unusual in distinguishing three levels of rounding (unrounded, compressed rounded and protruding rounded), which is relevant in distinguishing some phonemes, but apart from that, the rounding is fairly standard: /ʏ yː ø œ ɵ uː ʊ uː oː ɔ/ are rounded, the rest aren’t, just as in other languages that have these vowels. And of course, most form short/long pairs, so you could simplify the chart a lot: /i iː y yː ʉ ʉː e ɛ ɛː œ œː a aː u uː ɔ ɔː/ looks a lot easier to manage and is phonemically just as correct. Commented May 16, 2021 at 9:16

2 Answers 2

3

The "how" part is training on exemplars. First there needs to be some standard, and that was established by Daniel Jones with the cardinal vowel system. Essentially, Jones' students learned to produce the cardinal vowels, then taught their students. This provides reference points for a subset of the vowels in the IPA. The training tradition still exists in some institutions, and thanks to the miracle of the internet, one can find authoritative samples of the vowels (and consonants) performed by experts in the IPA, this chart from John Esling, and this chart with performances by Esling, House, Ladefoged and Wells (the Esling samples may be identical to his stand-alone collection). There are other such recordings, and classes that you can take.

These define the standard reference points for the IPA. If you hear Norwegian du you have a few choices as to which vowel it is closest to: credibly, [ʉ y Y] but not [u] or [æ]. If you listen to all of the reference samples, you will notice that the experts do not agree – this is a fundamental limit on the precision of the standard. Conventionally, "u" is assigned the value [ʉ] because (1) there is also [y] as in [dy], and (2) the vowel is auditorily closest to the standard [ʉ] for most expert performances. Each IPA symbol represents a range of values, and unfortunately ranges overlap a bit.

There is also a practice of micro-nudging vowel letters in the trapezoid, where the vowel [i] might be below the top line. This is the language-expert's judgment that the vowel is "a but lower", "a bit further back". Theoretically, this judgment can be aided by synthesizing vowels based on the formant values implied by this chart, and Keith Johnson did actually devise a "click on the chart" program which provided stimuli that aided people in making judgments as to where that vowel "is" (AFAIK it doesn't exist anymore for hardware reasons). One can generate comparative stimuli with Praat, which can give you a basis for saying "further back".

This is all about the phonetic values of vowels, and phonetic values are generally taken to be the primary determinant of vowel classification. However, phonological patterns also determine how people transcribe vowels. This is true to the point that people often disregard the phonetic facts in order to present a phonemic transcription, rather than a phonetic transcription. In Tigrinya, for example, the phoneme /ʌ/ is pronounced [ʌ ɛ æ a ɵ ɔ] depending on context, but this is (almost) never indicated in transcriptions, because it is rule-governed and people typically transcribe only contrastive details.

In other words, transcriptions and vowel charts are usually not claims about pronunciation, they are claims about the phonological system, but those claim are influenced by ideas of what the phonetics is. A couple of examples of phonetic vagarity are that the phoneme /e/ in Norwegian is usually a diphthong on the order of [ɛə], and the phonetics vs. phonology of Russian ы is a matter of extreme controversy (IMO [ɨ] is phonetically wrong but might be okay phonologically).

A chart like this might also represent mean formant values from a corpus in the language. Your particular chart looks more like a plot of computed formants, not a chart of auditory space.
2
  • Does it mean that, for example English /ə/ and /ʌ/ values can be phonetically different for different speakers? Does it also mean that some native speakers can pronounce them the same, i.e, merge the two phonemes universally, or can they be merged in marginally in speech, in a way that isn't considered phonologically significant? If it's true, how do we decide these are not allophones of the same phoneme? I do know, that it can occur dialectally, like /ə/, /ʌ/ neutralization before /r/, but I wonder if that's a normal phenomena cross linguistically.
    – big fellow
    Commented May 18, 2021 at 2:45
  • First, [ʌ] and [ə] are allophones of a single vowel, the former being stressed. But yes, two phonemes can absolutely merge to the point that they cannot be distinguished. Example, /t/ and /d/ in Am. Engl. in "writer", "rider" which both become [ɾ]. This relates to the very definition of "phoneme": allophones are by definition the always-recoverable variants of sounds, where you don't have to know that the segment is [t] (vs. [d]) in a related word.
    – user6726
    Commented May 18, 2021 at 14:41
5

In theory, that kind of chart represents an average position of the acoustic parameters of the first formant (F1) frequency, and second formant (F2) frequency (which don't actually correspond in a straightforward manner to tongue position).

If you were graphing actual data points, you would use a scatter plot. "The phonetics of schwa vowels" by Edward Flemming has some examples.

Aside from height, backness, and rounding, different vowel phonemes can have different lengths or different trajectories in the vowel space. E.g. English vowels often show diphthongization, where "tense" vowel phonemes usually have a trajectory that becomes closer and more peripheral and "lax" vowel phonemes may have a trajectory that becomes opener or more central. Russian ɨ (which is barely contrastive with [i], and so arguably not a distinct phoneme) apparently can show a velarized onglide.

Your Answer

By clicking “Post Your Answer”, you agree to our terms of service and acknowledge you have read our privacy policy.

Not the answer you're looking for? Browse other questions tagged or ask your own question.