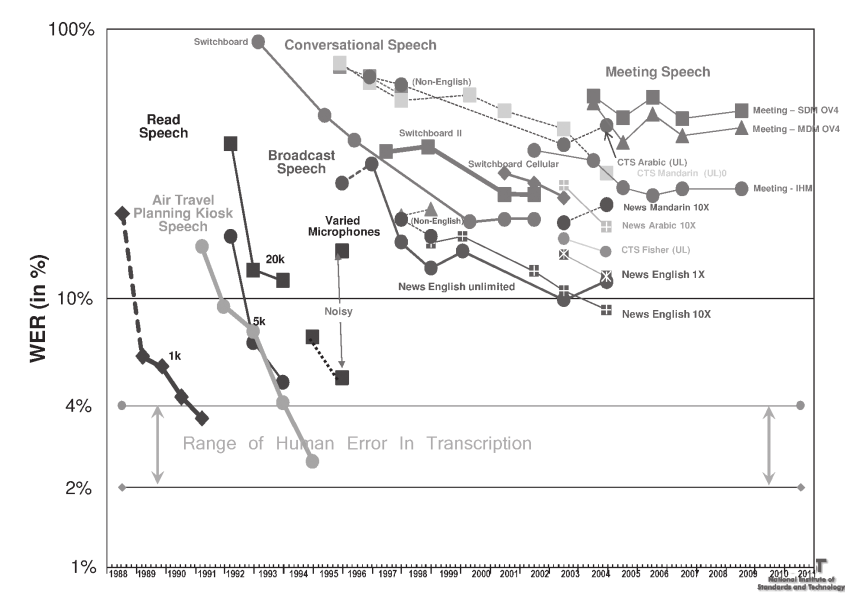
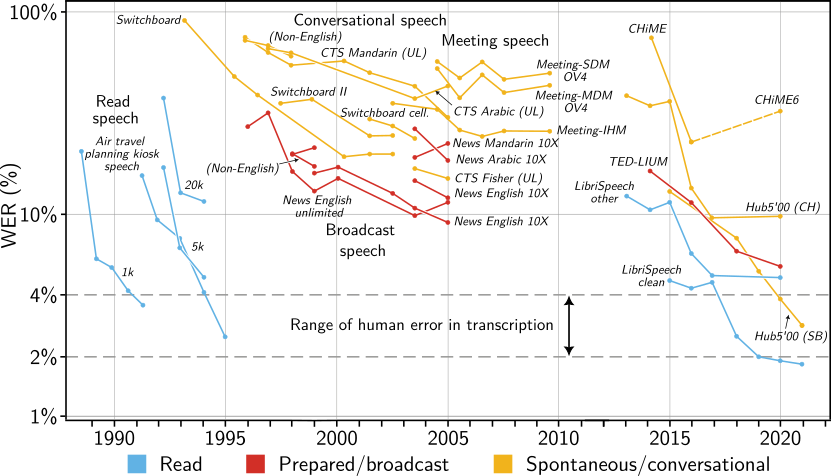
I am looking for an up-to-date (as of 2022) figure or table which displays the improvement in speech recognition on benchmarks for read and spontaneous speech over time, ideally in terms of word error rate. Somehing like this graph (from [1], reprinted in [2]):
but including more recent developments after 2009, especially results involving deep learning. The latest I could find (via inverse image search) is an Economist article from 2017, which does however not a good job of comparison (and their "sources" are, unfortunately, rather ridiculous: "Microsoft, research papers").
[1] J. Ajot and J. Fiscus, "Speech-To-Text (STT) and Speaker Attributed STT (SASTT) Results", NIST Rich Transcription Evaluation Workshop, 2009.
[2] T. Valenta and L. Šmídl, “Word confusions in the transcription and recognition of spontaneous Czech,” in Tackling the Complexity in Speech, vol. XIV, O. Niebuhr and R. Skarnitzl, Eds. Prague: Faculty of Arts, Charles University, 2015.

