2

We have a tone in notched noise in Praat. We want the noise to be 23 dB less than the tone, so we created a noise coefficient using SNR, applied this to the noise file, and combined it with the tone file to produce a tone in notched noise. We want to check and see that the tone is 23 dB higher than the noise after combining (i.e., to make sure no distortion in dB difference happened due to combining---it should always be 23dB). We think the best way to do this is to go to Analyse spectrum --> To spectrum.... I get a graph with frequency (Hz) on the x-axis and amplitude (dB) on the y-axis. When we look at the spectrum, the peak amplitude of the tone in noise does not match the intensity we obtain by clicking Query --> Get intensity... of the pure tone.

I have checked out Praat's internal manual under the Help button and also the extensive http://www.fon.hum.uva.nl/david/sspbook/sspbook.pdf. Circle 7 on Figure 7.16 on page 144 is pointing to the measurement that I am reading that is puzzling me.

Why is there a discrepancy between Query --> Get intensity... and the measurements we get by clicking on points on the spectrum (a point at the peak at the frequency of the tone and a point roughly where the average noise is)? What is truly being measured on the y-axis? In other words, to what is this intensity relative? Is this the best way to check the difference is 23 dB? Is there another way?
1 Answer 1

2

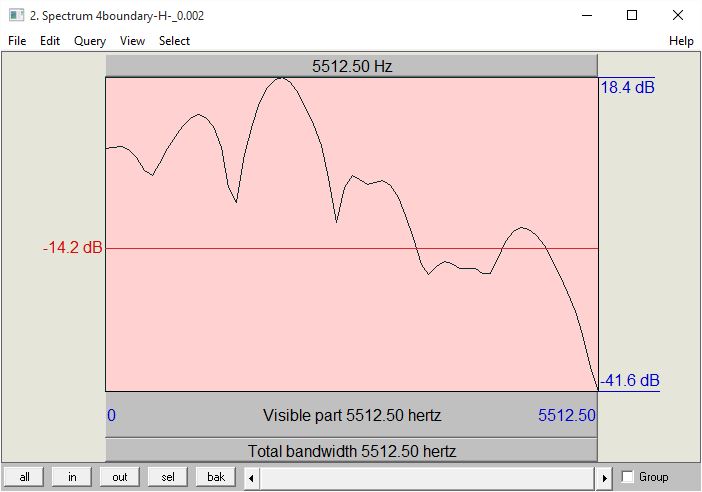
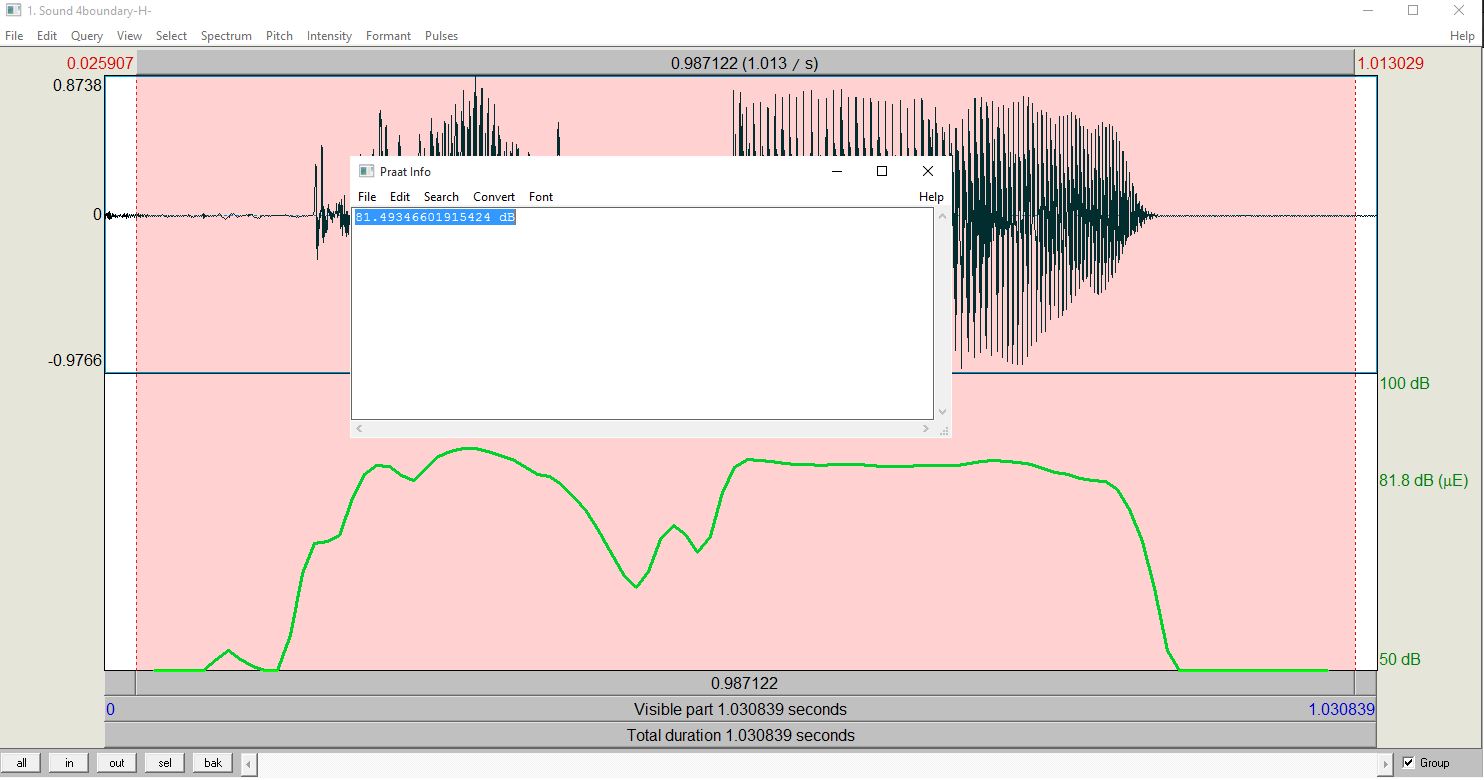
The number you get in Query ---> Get Intensity... is the mean intensity of the sound which for the sound file I have is 81.49346601915424 dB when I open the sound file in View and edit and select the whole sound file I will approximately get the same number: enter image description here

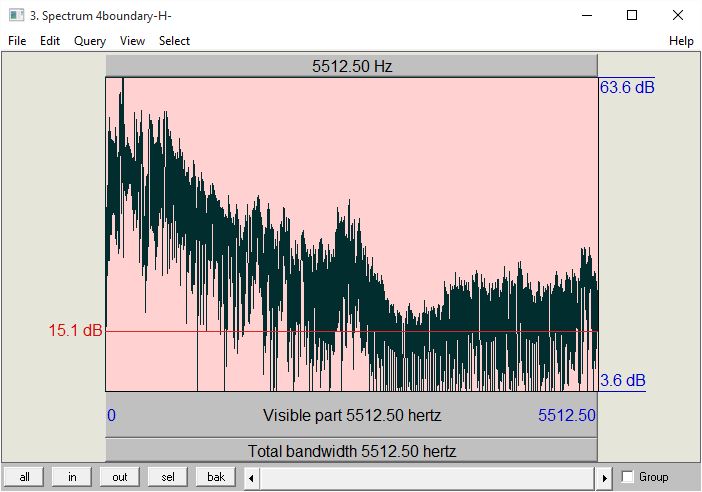
The windows showing spectrum analysis : enter image description here

As an alternative you can also select Spectrum ---> View Spectral Slice (Ctrl + L) to open a windows showing the intensity in dB.

enter image description here

So why are they different?!

Image number 2 shows the intensity of the sound in dB which the quietest is 0 and the loudest (in our recording is 63)

Image number 3 shows the relative amount of noise in your recording so for example the loudest noise in your recording will be marked as 0 and the lowest, obviously, will be negative. You can read more about A-Weighting here.

Lastly about the image number one. I really cannot understand what it is (by looking at it) but I presume it's some sort of scaling dB.

There was a mathematical review of the Praat's functions which I cannot find it right now.

EDIT: In general if you want to report the SNR in a research it's safer to report it in A-Weighting (Image number 3) it's more natural to grasp and easier to understand but if you are going to report the sound intensity in particular (for example you want to report that speakers of a certain language like Arabic speak louder than other speakers of let's say French) you can use dB. In the end it's up to you.

Your Answer

By clicking “Post Your Answer”, you agree to our terms of service and acknowledge you have read our privacy policy.

Not the answer you're looking for? Browse other questions tagged or ask your own question.