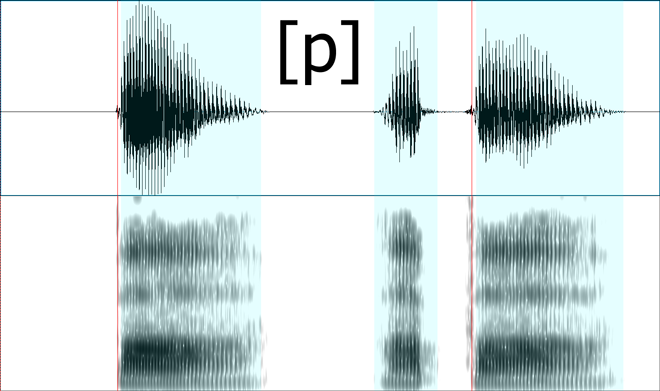
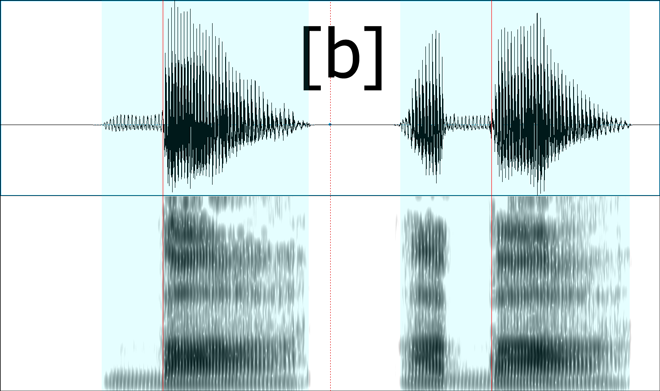
Since you asked about that particular chart and the accompany voice samples, I took the samples and laid them out in Praat, a tool designed for speech analysis.
The top half of the visual representation you see is a waveform, a visualization of air pressure on the y-axis and time on the x-axis. This is the actual energy your ear picks up and interprets as sound.
The bottom half is a spectrogram, which is a mathematical transformation of the waveform into its constituent frequencies. On the y-axis is the frequency (0 Hz to 5000 Hz) and on the x-axis is still time. A dark region at 3000 Hz at some particular time X means that the acoustic signal at that moment had strong "energy" in the 3000 Hz region.
Red and blue lines and regions are explained later.
A note to those who haven't heard the actual samples in question. They are in the environment /a/ /a_a/.
Here are the results (annotations as we go along):
Bilabials
Corresponding speech samples:
The important difference between [b] above and [p] below is the relatively low-amplitude vibration before the red lines. This vibration is seen in the waveform as a typical wave and seen in the spectrogram as a "band" of energy in the lower frequencies. This vibration is the result of the vocal chords vibrating.
In both cases, the time leading up to the red line is characterized by a complete closure of the vocal tract by the lips (hence the term "bilabial stop"). In [b], during this time, the vocal chords are vibrating. In [p], during this time, they aren't.
Velars
Corresponding speech samples:
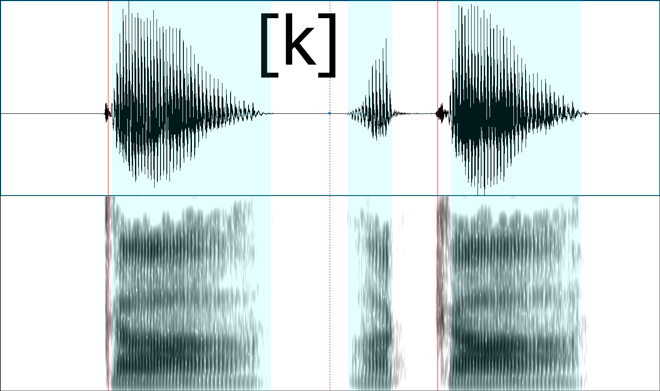
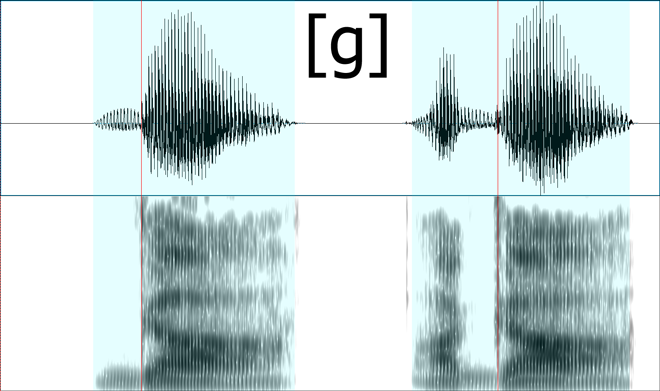
You see the exact same pattern here. The "stop" portions (the period immediately before the red lines) have flat waveforms and no voicing bar on the spectrograms.
Alveolars
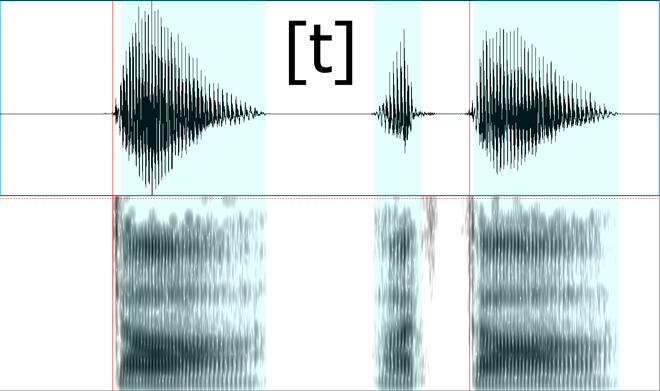
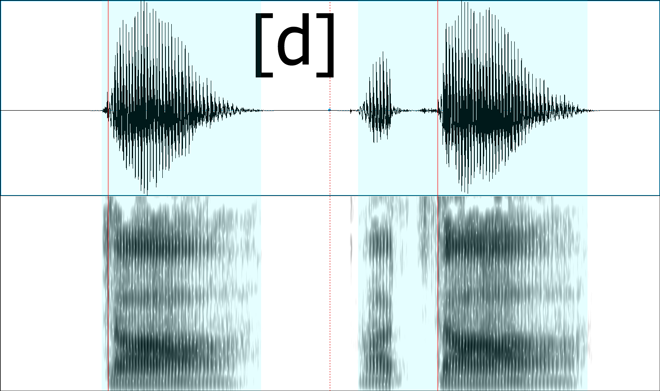
Corresponding speech samples:
You might have expected the pattern to continue here. I did too. I believe that the speaker flubbed the pronunciation of the [d] here. As you can see, there is no voicing in the stop periods.
I voiced my own version of [d] in the same frame, and this is the resulting spectrogram and sound:
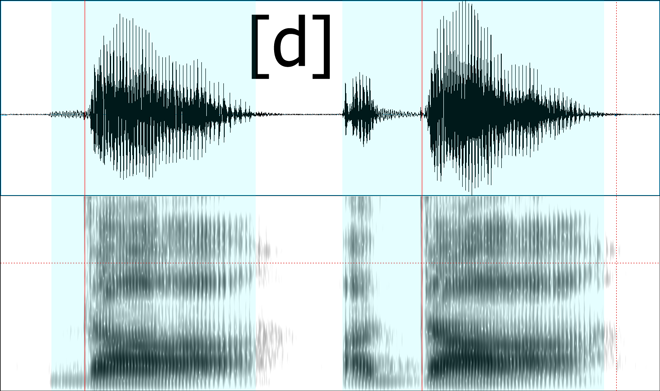
Sound: [d] version 2
Voiceless aspirated stops
Here are three voiceless aspirated stops (what we're used to seeing in English as /p t k/ when they occur as simple onsets at the beginning of stressed syllables):
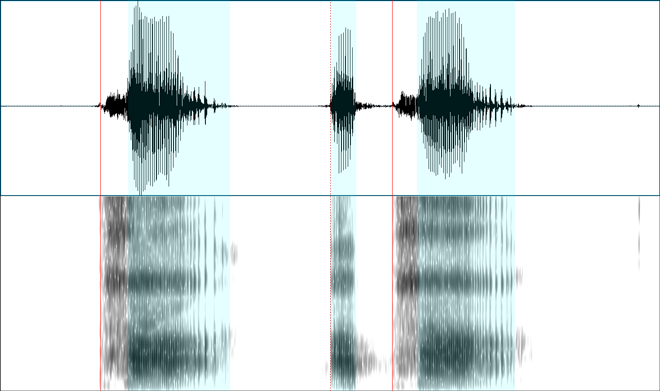
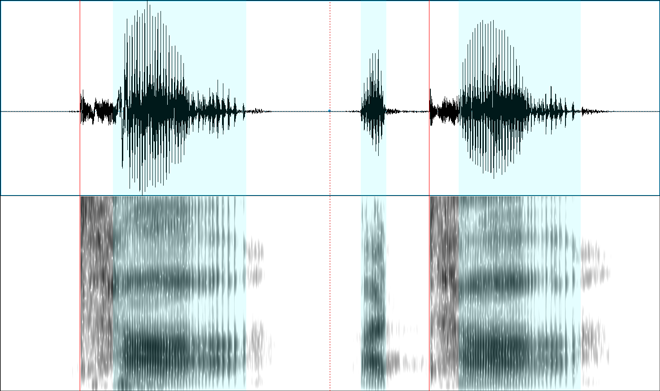
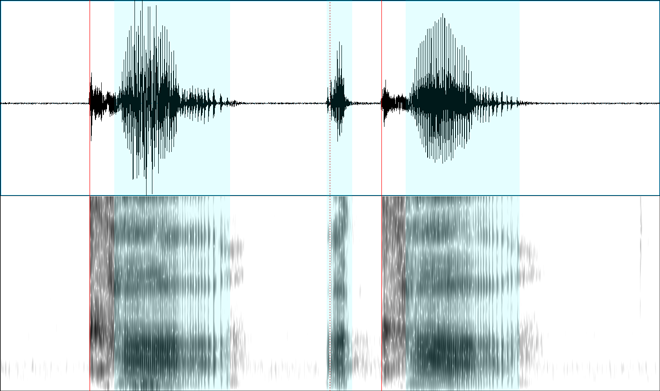
Notice in all these examples, there is considerable delay after the red line to the blue area.
Corresponding sound samples:
The spectrum
So you won't have to pick apart samples from above, here's a side by side comparison between [p] aspirated, [p] unaspirated, and [b]:

Onset of voicing (blue) occurs well after stop release (red).

Onset of voicing coincides with stop release.

Onset of voicing occurs well before stop release and also fills up intervocalic (between vowels) stop duration.
Corresponding speech samples:
Conclusions
So what does this mean for you. As a native English speaker, you have only ever been exposed to [p] aspirated and [p] unaspirated. You understand the former to be /p/ and the latter to be /b/.
When you get presented with a sound you've never heard before in that particular phonetic environment, your brain just associates it to the nearest match. Your brain disregards the voicing before the stop release and notices that there is no aspiration duration, concluding immediately that it is also /b/. This is helped in large part in that in even slightly rapid speech, the English sound /b/ appears not as an unaspirated [p] but actually a fully voiced [b] (e.g., in the word tabs).
And that's why you may not be able to tell.
It certainly didn't help that their [d] was undervoiced.


